A Gentle Introduction to Static Analysis with Ghidra Pcode
Why spend 10 minutes doing it manually when you can spend 10 hours automating it

ProfessionalChickenArtist

Motivation
As someone who has an interest in binary analysis, I wanted to explore how I can automate my static analysis workflow to speed up the analysis process. This brought me down the rabbit hole of Ghidra internals. Notably, how I can leverage a register transfer language called Pcode (that Ghidra is built on) for static analysis. However, along the way, I found it hard to find resources that provide a gentle introduction to Pcode, especially for the uninitiated like me. As such, I thought that I would take this opportunity to fill that gap with this article and hopefully provide a noob-friendly entry point to what Pcode is, and how it can be used for static analysis.
I assume some basic understanding of what Ghidra is and how it is used for binary analysis. I will stick to the same example binary throughout this whole article to make it easier to understand. If you want to follow along, the material I used in this article can be found in this Github repository.
Ghidra Decompilation Process
Firstly, it helps to understand how Ghidra's decompilation process works. To do so, I have a simple C programme that I compiled into a binary, shown below. While reading through this section, try to see the similarity in the code between different stages of the process. Don’t worry too much if it isn’t too clear, this will be explicitly shown in the later section.
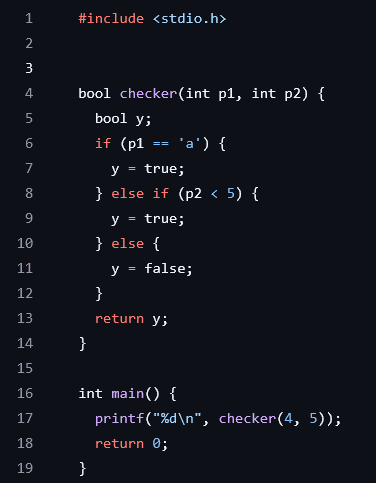 Figure 1: Source of example C programme
When a binary is first loaded into Ghidra, it is disassembled into machine instructions. A set of heuristics is then used to extract functions that are present in the binary. Figure 2 below shows the disassembled instructions of the checker function.
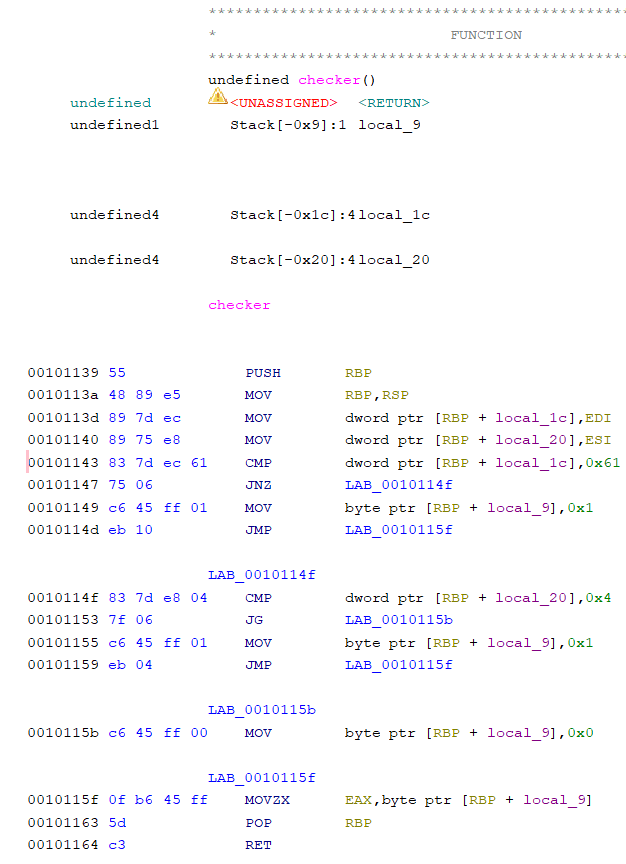 Figure 2: Disassembled code of checker function
Each function is then independently converted into a form of Pcode called raw Pcode. To do this, Ghidra has a set of specifications that directly convert each machine instruction into a series of 1 or more raw Pcode. The first few raw Pcode of the checker function is shown in Figure 3 (I truncated it as there are too many lines of raw Pcode). The lines shown correspond to the first 4 lines of disassembled code in Figure 2.
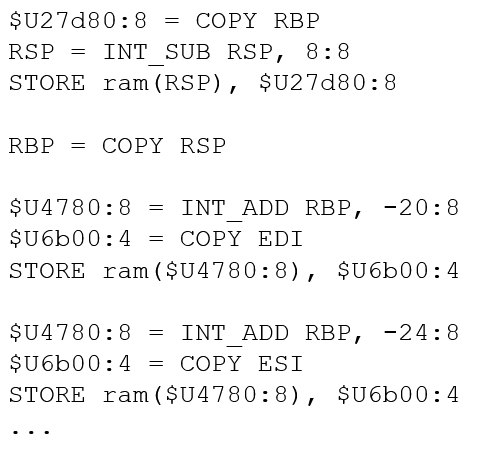 Figure 3: Raw Pcode of checker function
Next, the raw Pcode is then processed and optimized into High Pcode, which is a much more succinct representation of the function checker looks like this in High Pcode.
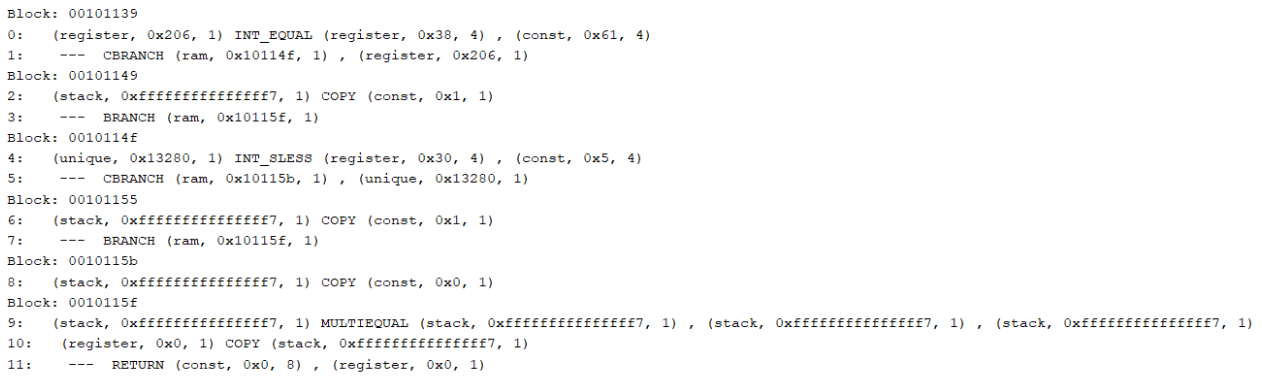 Figure 4: High Pcode of checker function
From this stage onwards, Ghidra then analyses the function’s High Pcode to generate the decompiled code you see in the Decompiler window.
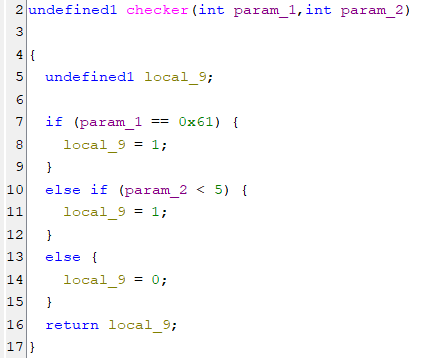 Figure 5: Decompiled checker function
This is just a brief overview of the decompilation process. A simple summary diagram of the decompilation process is given below. More details on the decompilation process can be found here.
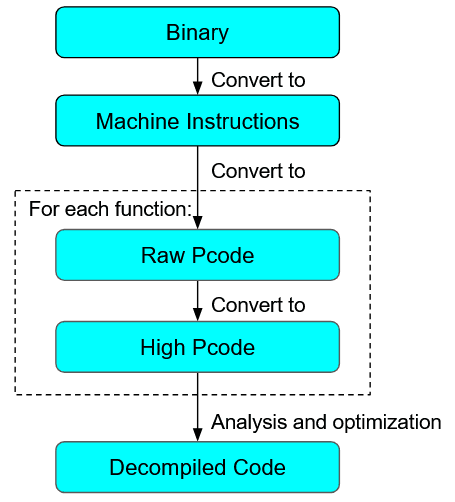 Figure 6: Ghidra Decompilation Process
What is important to note here is that Ghidra’s analysis runs on High Pcode. As such, a binary has to be converted first to High Pcode, before it can be analysed.
Purpose of Pcode
So why does Ghidra not directly analyse a binary? What is the purpose of converting a binary to Pcode before analysis? To answer this, we should consider that different binaries are compiled for different computer architectures, and will be disassembled into different Instruction Set Architectures (ISAs). If Ghidra develops its analysis engine directly on machine instructions, then the analysis engine has to cater to all possible architecture sets, which will make it hard to maintain. Instead, if we convert a binary to Pcode first, and build the analysis engine based off Pcode, we allow our analysis to be architecture agnostic: There is no need to have separate analysis workflows for x86, ARM, or MIPS binaries.
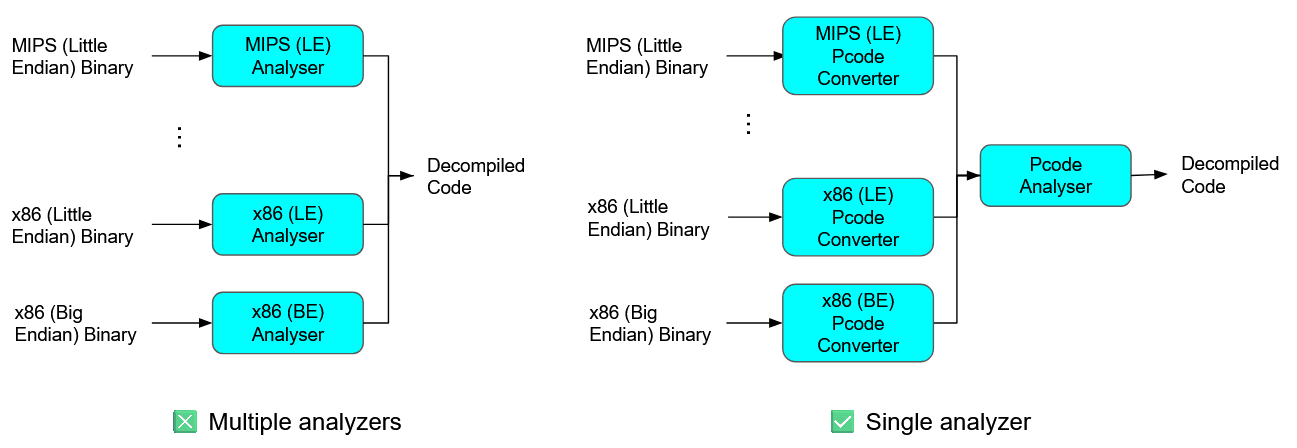 Figure 7: Purpose of Pcode
Considering its ability to abstract away architectural nuances, it will be useful for us to automate static analysis using Pcode.
In the previous section on Ghidra’s decompilation process, I mentioned that there are 2 forms of Pcode: raw Pcode and High Pcode. Practically, in the vast majority of cases we will only be interacting with the High Pcode of a binary. As such, for the remainder of this article, I will refer to High Pcode simply as Pcode. In any case, High Pcode is much more succinct and nicer to work with, which will make our scripting process much less painful.
What is Pcode
Pcode is actually really similar to other Instruction Set Architectures (ISAs) out there. It consists of 2 main components: PcodeOp and Varnodes. PcodeOp is analogous to an instruction mnemonic, with operations such as LOAD, CALL, and INT_ADD. Each PcodeOp takes as input 1 or more varnodes and outputs a single varnode. Varnodes are simply variables that PcodeOps work on. Each varnode can be seen as a 3-tuple, with values (address space, offset, size). As an example, the figure below shows a single PcodeOp, along with its inputs and outputs.
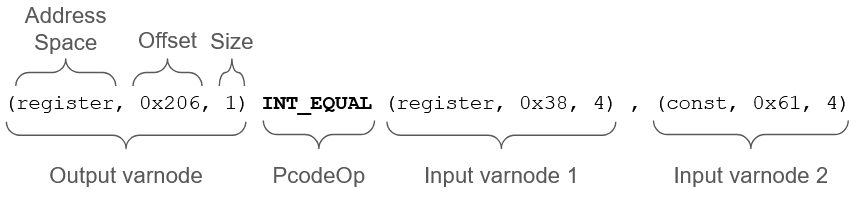 Figure 8: Anatomy of a line of Pcode
INT_EQUAL is a PcodeOp that checks if its 2 input varnodes are equal, and returns the truth value in its output varnode. Looking at the input varnodes, we see that input varnode 1 is of the register address space, indicating that its value is not fixed. On the other hand, varnode 2 has a constant address space. When a varnode has a constant address space, its offset field will contain the value of the varnode itself. In this case, it is 0x61. Therefore, we can guess that this line of Pcode is generated from source code that looks like y = (x == 0x61).
As a side note, some PcodeOps take in inputs whose purpose may not be immediately clear. As an example, the LOAD PcodeOp takes as its first argument a varnode whose value corresponds to the constant ID of the address space to load from. While these cases usually turn out to not be that important, it is recommended to refer to here to understand the details of each PcodeOp.
We can extend this understanding to analyse simple programs. In the figure below, we place the source and Pcode of the function checker side-by-side to explicitly show the correspondence in logic between the two.
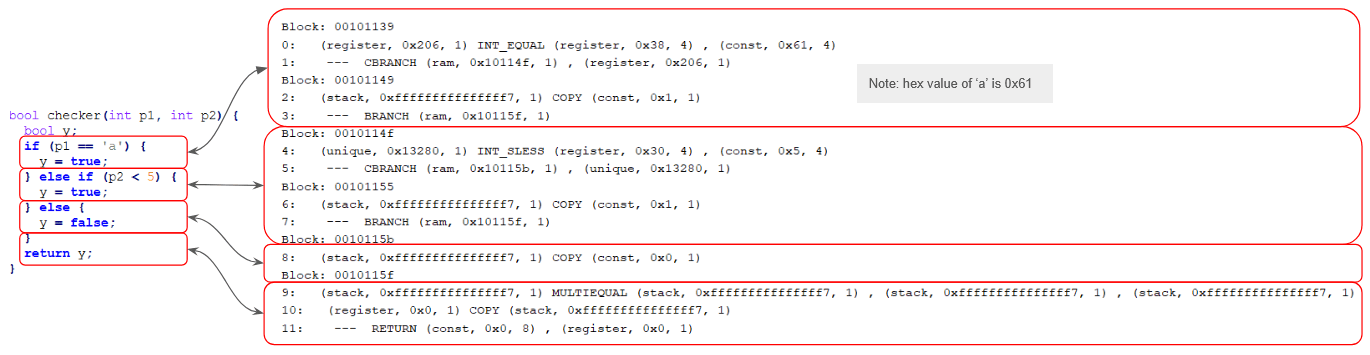 Figure 9: Source code to Pcode correspondence
On a side note, for whatever reason, there was no easy way to print the Pcode of a function out in sequential order for easy understanding, as in the figure above. There is an option to show the Pcode of each instruction in Ghidra’s listing view. However, that only shows the raw Pcode, which isn’t as intuitive and useful as High Pcode. Ghidra’s API also provides a getPcodeOps method to iterate through the Pcode of a function. However, it does not print the PcodeOps out in order, which makes it confusing to decipher. As such, I created my own script to do so, which you can find here.
The Pcode shown here are grouped into basic blocks, which are a continuous sequence of code with one entry point and one exit point: There are no branches in a single block. Line numbers are also printed on the left of each line of Pcode.
One nice thing about Pcode when it comes to analysing a function’s control and data flow is that it is in a Single Static Assignment (SSA) form. That is, each varnode is assigned only once, and has to be defined before use. This makes it easy to track the program’s flow, since we do not need to worry if a varnode is redefined (It can’t). As such, we can easily trace how a function works in Pcode by following the definitions of varnodes to get the function’s control flow graph.
On a side note, you may have noticed in the example above that the varnode (stack, 0xfff…ff7, 1) has multiple definitions in lines 2, 6 and 8, which looks as if SSA is not conformed to. However, it is just a visual issue that usually appears with the MULTIEQUAL PcodeOp. They are still separate varnodes in Ghidra.
It is also useful to know the address of each basic block as when a branch (E.g. CBRANCH, BRANCH) is encountered, the offset of the first varnode argument corresponds to the address of the block to jump to.
--- CBRANCH (ram, 0x10114f, 1) , (register, 0x206, 1)
At this stage, let us remind ourselves why we are learning about Pcode in the first place. We want to use Pcode to perform static analysis. A large part of static analysis is about tracing the flow of a program and its data. If you view a function as a graph, then this becomes a graph traversal problem. Pcode, with its SSA form, is ideal for traversing this graph. Following the same example above, by viewing basic blocks as nodes, and branches as a way to traverse between blocks, we can convert the lines of Pcode into a graph, as in Figure 10.
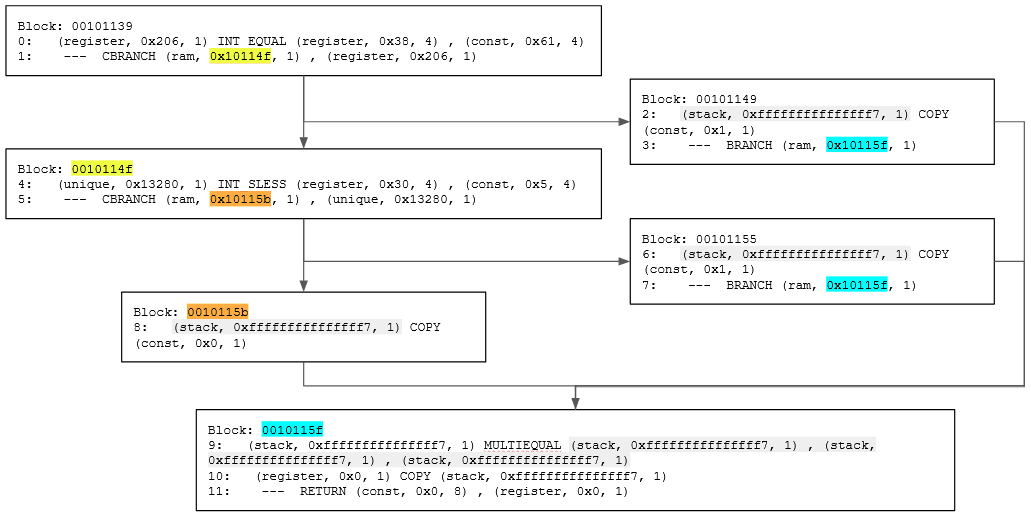 Figure 10: Function Pcode as a graph
The highlighted parts are varnodes and addresses that can be used to connect the different blocks together. Highlighted varnodes/addresses with the same colour are what creates the edges between blocks.
To trace the function’s flow backward, we can recursively search for the definition of varnodes. Conversely, to trace forward, we recursively search for the descendants of a varnode (locations where it is used).
Practical
Ok, we’ve finally cleared the necessary theoretical pre-requisites! As a mini practical, let us write a Ghidra script to perform taint analysis by traversing a function and obtaining all PcodeOps that are directly reachable from a parameter. While this may not be that useful of a script, it serves to give you a basic understanding of manipulating Pcode using the Ghidra API. The script’s main logic looks like this:
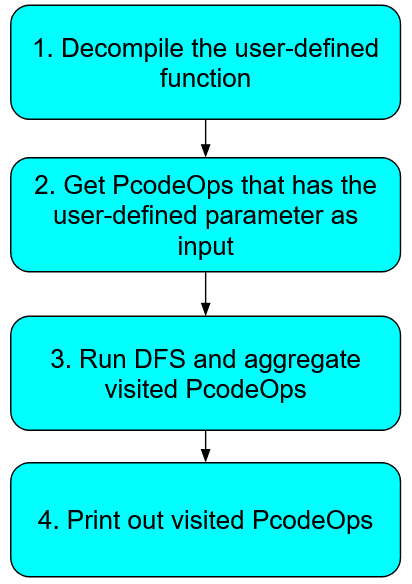 Figure 11: Overview of ParamTainter script logic
Since this article is focused on Pcode and static analysis, I will focus on function traversal with Pcode (step 3). The other steps involve some generic Ghidra scripting, such as using the API to decompile a binary. If you want to understand how the other steps are implemented, you can find the full script here, along with comments that are hopefully sufficient. It is also very useful to learn more about the Ghidra API via the Java Docs and the example scripts that come packaged with Ghidra. In any case, let us focus on the getTaintedPcodeOps function in the script for today.
Firstly, the function has a signature of:
private Set<PcodeOp> getTaintedPcodeOps(HighFunction highFunction, int paramIdx)
When working with Pcode, you commonly will start off with a HighFunction object, which is just a function in the binary that has been decompiled.
getTaintedPcodeOps starts off by obtaining the varnodes that represent the parameter to be tainted.
LocalSymbolMap symbolMap = highFunction.getLocalSymbolMap();
if (paramIdx > symbolMap.getNumParams()) {
 throw new Exception(String.format("Function does not have %d parameters.", paramIdx));
}
HighParam param = symbolMap.getParam(paramIdx);
Varnode[] startingVarnodes = param.getInstances();
To obtain a parameter of the function, we can use HighFunction.getLocalSymbolMap().getParam(index). This returns a HighParam object, which is a representation of the parameter we want. Since the parameter can be used at multiple places throughout the function, there is a HighParam.getInstances method to get an array of varnodes startingVarnodes that represent the parameter. This is where the Pcode traversing starts.
As we are viewing the function as a graph, it is natural to implement our tainting logic using graph traversal algorithms. In this case, we use a straightforward Depth-First Search (DFS) to find all PcodeOps that are directly tainted by our chosen parameter.
// DFS to search for reachable PcodeOps
// Set up DFS
List<PcodeOp> frontier = new ArrayList<>();
for (Varnode startingVarnode : startingVarnodes) {
 for (Iterator<PcodeOp> it = startingVarnode.getDescendants(); it.hasNext(); ) {
   frontier.add(it.next());
 }
}
Set<PcodeOp> taintedPcodeOps = new HashSet<>();
// Run DFS
while (!frontier.isEmpty()) {
 PcodeOp op = frontier.removeFirst();
 if (taintedPcodeOps.contains(op)) continue;
 taintedPcodeOps.add(op);
 Varnode nextVarnode = op.getOutput();
 if (nextVarnode == null) continue;
 for (Iterator<PcodeOp> it = nextVarnode.getDescendants(); it.hasNext(); ) {
   PcodeOp nextOp = it.next();
   frontier.add(nextOp);
 }
}
return taintedPcodeOps;
We first start off by finding the initial PcodeOps to start searching from. This will be the set of PcodeOps that utilises the varnodes in startingVarnodes as input, which we can get by using the Varnode.getDescendants method.
Then, in our DFS, for every unvisited PcodeOp, we want to extend our search to other connected PcodeOps. To do so, we first use the PcodeOp.getOutput method to get the output varnode of the current PcodeOp (nextVarnode). To get the child PcodeOps, we use Varnode.getDescendants again. We then add these child PcodeOps to the stack of unvisited PcodeOps, as per a typical DFS algorithm.
Lastly, we return the PcodeOps that have been visited.
Yes, it’s as simple as this!
What we have implemented here is forward tainting of a parameter. If you want to implement the reverse (backward tainting), you can use Varnode.getDef to get the PcodeOp that defines a varnode, and PcodeOp.getInputs to get the input varnodes to a PcodeOp.
Just a quick tip: When writing scripts of static analysis, you may end up wanting to get locations in the decompiled function that has a series of consecutive PcodeOps. For example, you may want to find locations where an INT_ADD is followed by a INT_EQUAL. In such cases, always ensure your algorithm is resilient to COPY operations, as they may appear in between the PcodeOps you want to detect. In other words, ensure your script can detect INT_ADD → COPY → COPY →…→ INT_EQUAL too.
Conclusion
To recap, we first introduced the motivation to learning Pcode, before going into the weeds of the purpose of Pcode in Ghidra, what Pcode exactly is, and how it represents decompiled functions. As a small exercise, we then utilised the Ghidra API to traverse a function’s Pcode to taint a parameter.
Ok, that’s a wrap from me! Hopefully this article is helpful in giving you an intuitive understanding of what Pcode is and how it can be used for static analysis. :D